Computers
All client devices that have been added to ESET PROTECT are shown here and are divided into groups. Each device is assigned to a single static group. Clicking a group from the list (in the tree) will display the members (clients) of this group in the main pane.
Unmanaged computers ![]() (clients on the network that do not have the ESET Management Agent) usually appear in the Lost & found group. The status of a client that is shown in the ESET PROTECT Web Console is independent from the settings of the ESET security applications on the client. That is why even if a certain status is not displayed on the client, it is still reported to the ESET PROTECT Web Console. You can drag and drop clients to move them between groups.
(clients on the network that do not have the ESET Management Agent) usually appear in the Lost & found group. The status of a client that is shown in the ESET PROTECT Web Console is independent from the settings of the ESET security applications on the client. That is why even if a certain status is not displayed on the client, it is still reported to the ESET PROTECT Web Console. You can drag and drop clients to move them between groups.
Click the Add Device button and create an installer to manage and protect your devices.
Click a device to open a new menu with actions available for that device. You can also select the check box next to a device and click the Computer button on the bottom bar. The Computer menu will display different options depending on the type of device. Refer to the Icon legend for details about different icon types and statues. Click the number of alerts in the Alerts column to see the list of alerts in the computer details section.
Last Connected displays the date and time of last connection of the managed device. A green dot indicates that the computer connected less than 16 minutes ago. The Last Connected information gets highlighted to indicate that the computer is not connecting:
oYellow (warning)—computer is not connecting for 2–14 days.
oRed (error)—computer is not connecting for more than 14 days.
The enrolled mobile devices must connect to ESET PROTECT every 120 days to prevent connection problems. You can see this information in the link from the enrollment email or QR code. Do not enroll a spare device in advance. We recommend only enrolling a spare device that will be used within 120 days. |
The Inspect ![]() icon opens the ESET Inspect Web Console Computers section. ESET Inspect is only available when you have ESET Inspect subscription and ESET Inspect connected to ESET PROTECT. A Web Console user requires Read permission or higher for Access to ESET Inspect.
icon opens the ESET Inspect Web Console Computers section. ESET Inspect is only available when you have ESET Inspect subscription and ESET Inspect connected to ESET PROTECT. A Web Console user requires Read permission or higher for Access to ESET Inspect.
Filtering the view
There are different ways to filter your view:
•Standard filter: To filter, click Add Filter:
1.In some filters, you can select the operator by clicking the operator icon next to the filter name (the available operators depend on the filter type):
Equal to or Contains
Not equal to or Does not contain
Greater than or equal to
Less than or equal to
2.Select one or more items from the list. Type a search string or select the items from the drop-down menu in the filter fields.
3.Press Enter. Active filters are highlighted in blue.
•You can filter by severity using the status icons: red - Errors,
yellow - Warnings,
green - OK and
![]() gray - Unmanaged computers. The severity icon represents the current status of your ESET application on a specific client computer. You can use a combination of these icons by turning them on or off. For example, to see only the computers with warnings, leave only the
gray - Unmanaged computers. The severity icon represents the current status of your ESET application on a specific client computer. You can use a combination of these icons by turning them on or off. For example, to see only the computers with warnings, leave only the yellow icon selected (the rest of the icons must be deselected). To see both,
warnings and
errors, leave only these two icons on.
•You can filter by Incident severity— High,
Medium,
Low and
None. You can use a combination of these icons by turning them on or off.
•Click Add Filter > Application Category and using the drop-down menu, you can select the types of devices to be displayed.
oESET Protected—protected by an ESET application—![]() Desktop,
Desktop, ![]() Mobile,
Mobile, ![]() Server,
Server, ![]() Mail Server,
Mail Server, ![]() Gateway Server,
Gateway Server, ![]() Collaboration Server,
Collaboration Server, ![]() File Server.
File Server.
oESET PROTECT—individual ESET PROTECT components—![]() ESET Management Agent,
ESET Management Agent, ![]() Rogue Detection Sensor.
Rogue Detection Sensor.
oOther—![]() ESET LiveGuard,
ESET LiveGuard, ![]() ESET Inspect Connector,
ESET Inspect Connector, ![]() ESET Full Disk Encryption,
ESET Full Disk Encryption, ![]() ESET Bridge,
ESET Bridge, ESET Vulnerability & Patch Management.
• Show subgroups—select the check box to show subgroups within the currently selected group.
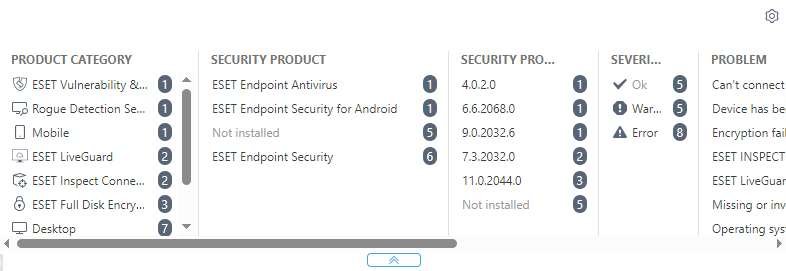
•You can see Advanced filters as an expandable filter panel on the Computers screen.

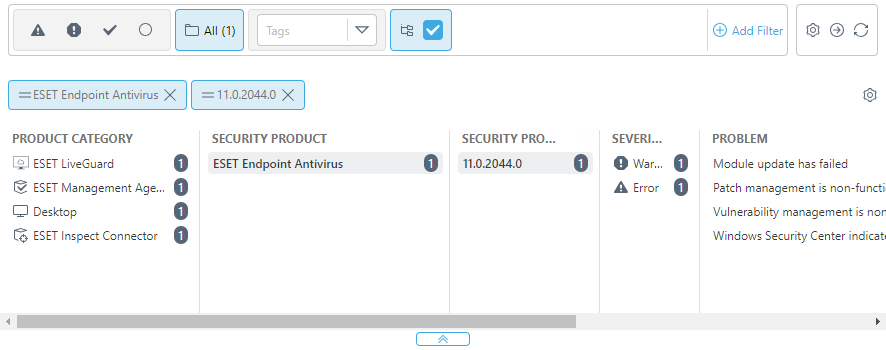
Advanced filters show a real-time preview of values for various filters and the exact number of results for your selection.
Advanced filters show you which filter values will return a manageable number of results when filtering large sets of computers, allowing you to find the right devices much more quickly.
Click items in the columns to apply the filter. The applied filters appear on the top of the advanced filters as blue bubbles. Click the applied filter to toggle filtering the equal or not equal value.

Click the ![]() gear icon in a column to sort the values in the column or click the
gear icon in a column to sort the values in the column or click the ![]() gear icon on the top of advanced filters. Use the wizard to adjust (
gear icon on the top of advanced filters. Use the wizard to adjust (![]() add,
add, ![]() remove,
remove, ![]()
![]() reorder) the displayed columns. You can also use drag-and-drop to adjust the columns. Click Reset to reset the table columns to their default state (default available columns in a default order).
reorder) the displayed columns. You can also use drag-and-drop to adjust the columns. Click Reset to reset the table columns to their default state (default available columns in a default order).
You can use advanced filters only with Static Groups. Dynamic Groups do not support advanced filters. |
•Use Dynamic Groups or Reports for more advanced filtering.
•To find the computers marked as Master for cloning, click Add Filter > select Master for cloning > select the check box next to the Master for Cloning filter.
Filters and layout customization
You can customize the current Web Console screen view:
•Manage the side panel and main table.
•Add filters and filter presets. You can use tags for filtering the displayed items.
You can mute a device by selecting ![]() Mute from the context menu. The purpose of muting a device is to:
Mute from the context menu. The purpose of muting a device is to:
•Visually suppress the background color of the row in Computers while still displaying the number of Alerts. The Alerts are functional problems reported from the computer, and the color of the number is based on the level/severity of the worst problem (medium—yellow, high—red).
•Suppress the impact on statistics in dashboards, specifically in tiles related to functional problems (for example, Computer status and Top functional problems).
If you cannot find a specific computer in the list and know it is in your ESET PROTECT infrastructure, ensure that all filters are turned off. |