Incidents
Incidents allow us to correlate indicators into incidents, improving threat investigations. Incidents are created automatically from indicators, which significantly reduces alert triage time. Incidents provide a comprehensive view of security issues by grouping together relevant data, allowing administrators to analyze, prioritize, and respond effectively to potential cybersecurity incidents.
|
All users can view the Incidents section. The difference lies in the data sources used to generate incidents. More data leads to: •a higher number of incidents. •more contextual information in the Incidents section. The Incident creator receives all data that is collected from the user´s environment based on their product. The volume of collected data is dependent on the user´s subscription tier and the products deployed on their endpoints. |
Click the Incidents section in the main menu or go to Computers > select the computer > click the three dots ![]() button > View Incidents.
button > View Incidents.
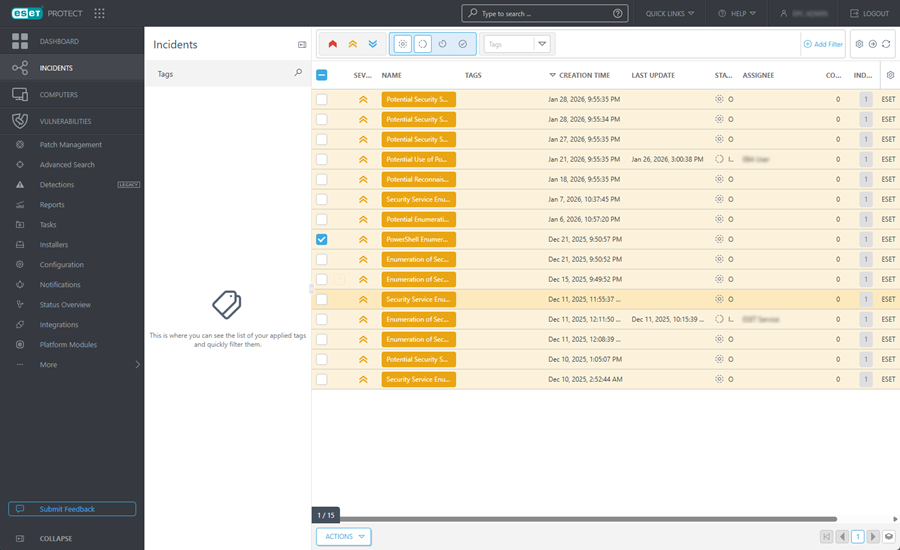
Filtering the view
There are different ways to filter your view:
•Click the Tags selector (arrow icon) and choose a tag(s) to activate the filter on the listed incidents. Results are highlighted in blue and show incidents with the selected tags.
•Click an Incident severity—![]() High,
High, ![]() Medium or
Medium or ![]() Low. You can combine these icons by turning them on or off.
Low. You can combine these icons by turning them on or off.
•Incident status—![]() Open,
Open, ![]() In progress,
In progress, ![]() Waiting for input or
Waiting for input or ![]() Closed
Closed
•Click Add Filter and select incident types from the drop-down menu.
oAssignee—type the assingee name.
oAuthor—select from the drop-down menu: ESET, ESET Service or the username.
oClose reason—select from the drop-down menu: All, False positive, Suspicious, True positive.
oCreation time—select from the drop-down menu: ≤ Today, ≤ 24h ago, ≤ 3 days ago, ≤ 7 days ago, ≤ 14 days ago, ≤ 30 days ago, ≤ 90 days ago or ≤ 180 days ago.
oLast update—select from the drop-down menu: ≤ Today, ≤ 24h ago, ≤ 3 days ago, ≤ 7 days ago, ≤ 14 days ago, ≤ 30 days ago, ≤ 90 days ago or ≤ 180 days ago.
oName—type the incident name.
oNumber of computers—type the number of selected computers.
oNumber of indicators—type the number of selected indicators.
oNumber of users—type the number of selected users.
Filters and layout customization
You can customize the current Web Console screen view:
•Manage the side panel and main table.
•Add filters and filter presets. You can use tags for filtering the displayed items.
|
If you cannot find a specific incident in the list and know it is in your ESET PROTECT infrastructure, ensure that all filters are turned off and permission sets are assigned to your user account. |
|
The permissions you configure are applied to the parent company of the static group you selected in the Static Groups step. |
|
|
|
Open the ESET Inspect Web Console Incidents section. ESET Inspect is only available when you have ESET Inspect subscription and ESET Inspect connected to ESET PROTECT. A Web Console user requires Read permission or higher for Access to ESET Inspect. |
|
Refresh the page. |
Actions
Select any incident(s), click the Actions button or click the three dots ![]() button to:
button to:
•View Details—click to display incident details.
•Change Status & Assignee—click to select from the drop-down menu.
oStatus—select the incident's current status from the drop-down menu: Open, In progress, Waiting for input or Closed. When you select Closed, additionally select the reason for closing the incident (True positive, Suspicious, False positive or invalid) and optionally write a comment.
oAssignee—when you selected Open or In progress status, select the available user from the drop-down menu.
Click Save.
•Edit Tags—click to select tags from the drop-down menu and click Apply. Or you can type a new keyword and press Enter to create a new tag.
•Create Report—click to generate a PDF report from any selected incident. PDF report exports key details such as correlated indicators, affected assets and timeline. You can generate a report only for one selected incident.