Navigate the ESET Inspect Web Console
Look at how to navigate your way through the ESET Inspect Web Console interface. You can soon become familiar with the navigational elements and tools of the ESET Inspect Web Console, which aim to be intuitive and easy to use while being interactive.
Here is an overview of most of the interface's elements:
Side bar
Use the navigation bar on the left side to switch between different parts of the ESET Inspect console:
Toolbar at the top is available at all times:
![]()
•ESET PROTECT ecosystem / ESET Business ecosystem—A quick access to the ESET PROTECT Web Console and other useful links.
•Learning mode / Questions—Items that concern some of the ESET Inspect functionality (for example, automatic exclusions, database purge, LiveGrid®, etc.).
•All Computers—Acts as a quick filter. Click to view groups or computers and make your selection.
•Help—Links to Online Help for the current screen. ESET Inspect Product Tour shows main features of the product. License opens the web page with ESET Inspect End User License Agreement. The About page provides detailed information about the ESET Inspect version and links to legal documents.
•User (currently logged in)—Shows the username.
•Logout—Shows the time remaining until automatic logout. The timer is reset every time you interact with the ESET Inspect Web Console (click a button, tab, submenu or an item). Click Logout to leave the ESET Inspect Web Console, or to log in as a different user.
Side panel layout
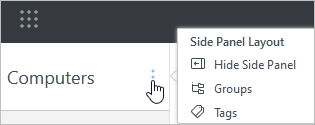
Click the ![]() icon next to the section name (Computers) to adjust the side panel layout using the context menu (available options may vary based on the current layout):
icon next to the section name (Computers) to adjust the side panel layout using the context menu (available options may vary based on the current layout):
•Hide side panel
•Show side panel
•Groups
•Groups and Tags
•Tags
Preview panel
Click a Computer name or Detection to display the preview panel on the right side. While serving as a quick view, this panel contains vital information about the selected Computer or Detection.
Tags
You can use tags to further refine filtering of displayed items. Available tags are listed in the Tags side panel (click the ![]() icon to adjust the view). To add tags to a computer, select a computer (or multiple computers) and use the action button Tags at the bottom.
icon to adjust the view). To add tags to a computer, select a computer (or multiple computers) and use the action button Tags at the bottom.
Tables
Table view is present in many ESET Inspect Web Console sections. You can modify and rearrange the columns to your needs. To reorder, hover the mouse over the ![]() icon next to the column name and drag-and-drop to the desired position. To sort, click the column you want to sort by. This results in ascending (A–Z, 0–9) sorting, click again for descending (Z–A, 9–0). A small arrow before the column header indicates the sorting behavior. Click the gear
icon next to the column name and drag-and-drop to the desired position. To sort, click the column you want to sort by. This results in ascending (A–Z, 0–9) sorting, click again for descending (Z–A, 9–0). A small arrow before the column header indicates the sorting behavior. Click the gear ![]() icon for table options, add or remove columns according to your needs. See the definition of each column.
icon for table options, add or remove columns according to your needs. See the definition of each column.
Context menu / Action buttons
Right-click an item in the table for the context menu with all available actions. The buttons on the bottom of the page are unique for each section and function, and are described in detail in their respective chapters.
Filtering
Usually, there are too many results displayed in the table, and that is where filtering comes to the rescue. To narrow down the view when searching for specific items (computer, detection, incident, executable, script, etc.) use pre-defined filter(s) or add a custom one. To further refine the results, combine the filters. If you want to recall the filter combination in the future, click Presets button and save it.
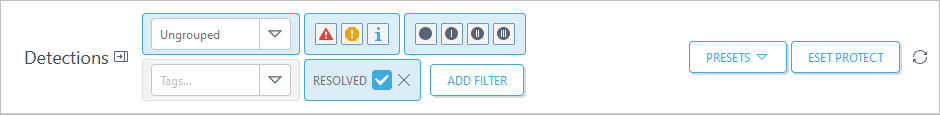
Add filter and filter presets
To add filtering criteria, click Add filter and select item(s) from the list. Click Presets to manage or recall filter sets. See detailed information about filters.
Severity and Status (filter icons)
Click an icon to hide items. All icons are activated by default, meaning items with all seventies or statuses are displayed. Click an icon to deactivate (filter out) items with specific severity or status.
|
Detection(s) with threat severity present on this computer. |
|---|---|
|
Detection(s) with warning severity present on this computer. |
|
Detection(s) with informational severity present on this computer. |
|
No detections were triggered on this computer, or all are resolved. |
|
ESET Inspect Connector is not installed on this computer. (ESET Inspect know about this computer because the ESET PROTECT sent it from an Active Directory). |
Priority (filter icons)
Click to show only items with specific priority. There are four types, no priority and priority I to III. All icons are deactivated by default, meaning the items with all priorities are displayed. Click the priority icon to activate the filter and show only items with selected priority.
OS type (filter icons)
Click an icon to hide items. Filter by Operating System platform to see or hide the executables for ![]() Windows,
Windows, ![]() macOS or
macOS or ![]() Linux.
Linux.
Executable type (filter icons)
Click to see only ![]() EXE or
EXE or ![]() DLL files, or both simultaneously, where:
DLL files, or both simultaneously, where:
EXE = executable file
DLL = library file
Blocked and Safe
You can filter executables to only see ![]() Blocked or
Blocked or ![]() Safe or both types of files.
Safe or both types of files.
Access group
You can filter items by access groups assigned to you.
Other control elements:
•Expand and collapse the navigation menu. Collapsing the panel provides more dashboard screen space. To expand the navigation panel, click the ![]() icon.
icon.
•Click ![]() refresh icon to reload/refresh displayed information.
refresh icon to reload/refresh displayed information.
•If available, the export icon ![]() can be used to export the table grid to CSV format and use it in other applications to work with the list.
can be used to export the table grid to CSV format and use it in other applications to work with the list.
•Click the ESET Inspect logo to open the Dashboard screen.