Diagnostic Tool
The diagnostic tool is a part of all ESET PROTECT components. It is used to collect and pack logs that can be used by technical support agents and developers to solve problems with product components.
Diagnostic Tool location
Windows
Folder C:\Program Files\ESET\RemoteAdministrator\[product]\Diagnostic.exe.
Linux
In the following directory on the server: /opt/eset/RemoteAdministrator/[product]/, there is a Diagnostic[product] executable (one word, for example, DiagnosticServer, DiagnosticAgent)
Usage (Linux)
Run the diagnostics executable in the terminal as root and follow the instructions displayed on your screen.
Usage (Windows)
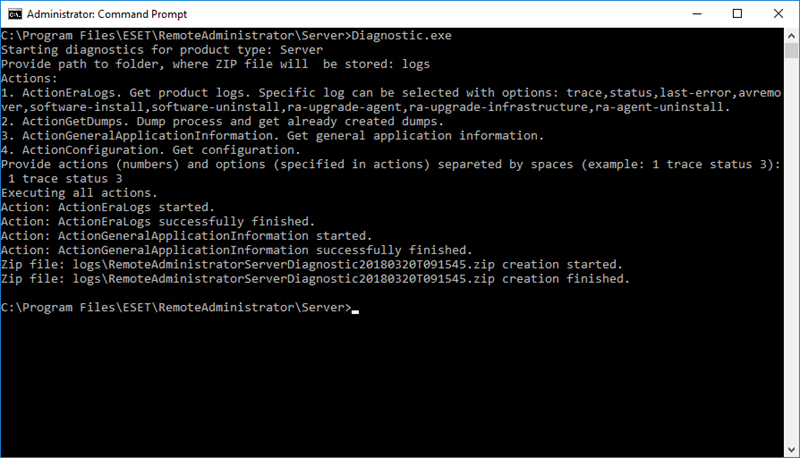
1.Run the tool using a Command Prompt.
2.Type the location of log files to be stored (in our example "logs") and press Enter.
3.Type the information you want to gather (in our example 1 trace status 3). See Actions below for more information.

4.When you are finished, you can find the log files compressed in a .zip file in the "logs" directory in the Diagnostic Tool location.

Actions
•ActionEraLogs - A logs folder is created where all logs are saved. To specify certain logs only, use a space to separate each log.
•ActionGetDumps - A new folder is created. A process dump file is generally created if a problem was detected. When a serious problem is detected, a dump file is created by system. To check it manually, go to the folder %temp% (in Windows) or folder /tmp/ (in Linux) and insert a dmp file.
The component service (Agent, Server, RD Sensor) must be running. |
•ActionGeneralApplicationInformation - The GeneralApplicationInformation folder is created and inside it the file GeneralApplicationInformation.txt. This file contains text information including the product name and product version of the currently installed product.
•ActionConfiguration - A configuration folder is created where file storage.lua is saved.