Advanced Search
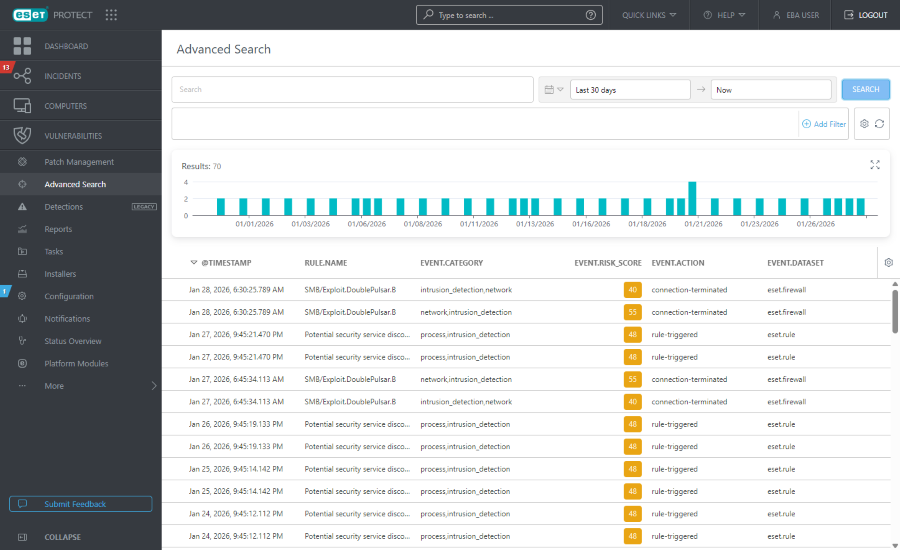
The ![]() Advanced Search section enables advanced investigation of Open XDR Data indicators and provides standard capabilities such as searching, querying and listing.
Advanced Search section enables advanced investigation of Open XDR Data indicators and provides standard capabilities such as searching, querying and listing.
Note that the Advanced Search data is unavailable for ESET PROTECT users with custom permissions assigned in improperly configured Companies. Users with custom permissions assigned in properly configured Companies have the data from these Companies available in the Advanced Search section. |
Open XDR Data is available from computers running ESET Management Agent version 13.0+ and ESET Inspect Connector 3.0+. Find more about unifying ESET Inspect and ESET PROTECT (Open XDR). |

Main page components are:
Query filter
Type a Lucene query or full text to search.
Date filter
Use the date filter to limit results to a specific time window for focused investigation.
1.Click the calendar icon and select Single time or Timespan from the drop-down menu:
•Single time—click the Select date field to select a pre-defined relative range (Last 15 min, Last 30 min, Last hour, Last 24 hours, Last 7 days, Last 14 days, Last month) or define a custom relative range via Select direction, Enter amount and Select unit.
•Timespan—click the Start date and End date to specify them as either Relative or Absolute (exact dates/times).
2.Click Run to apply the filter and update results.
Filter panel
You can filter by specific Open XDR Data fields and values. Click Add Filter or click into the filter panel to select a field and set its value.
1.Select an Open XDR Data field from the list. In the filter field, type a search term or select items from the drop-down menu.
2.For some filters, you can select the operator by clicking the operator icon next to the filter name (the available operators depend on the filter type):
Equal to or Contains
Not equal to or Does not contain
Greater than or equal to
Less than or equal to
3.Press Enter. Active filters are highlighted in blue.
•You can filter by severity using the icon-based eset.severity filter. You can use a combination of icons— High,
Medium,
Low by turning them on or off. For example, to view only the events with medium severity, leave only the
yellow icon selected (the rest of the icons must be deselected). To view both,
medium severity and
high severity, leave only these two icons on.
•Filters can be saved to your user profile so that you can use them again in the future. Click the ![]() Presets icon to manage filter sets:
Presets icon to manage filter sets:
Filter sets |
Your saved filters, click one to apply it. The applied filter is denoted with a |
|
Create a new preset from your current filter configuration. When the preset is saved, you cannot edit the filter configuration in the preset. Select Include time range and columns in this template to save the time range and column visibility in the preset. |
|
Remove or rename existing presets. Click Save to apply the changes to presets. |
|
Click to remove only the current values from all filter fields in the filter panel. Saved presets will remain unchanged. |
|
Click to remove all filter fields from the filter panel. Saved presets will remain unchanged. |
|
Remove filter fields with no value from the filter panel. Saved presets will remain unchanged. |
|
Reset the filter panel and show the default filters. Saved presets will remain unchanged. |
Results
Results are visualized in the histogram displaying the number of hits against aggregated time intervals for the currently filtered events.
•Click a bar to drill down into events for the specific interval. The time/date filter updates to the bar’s start and end time, and the results reload automatically.
•Click and drag across the histogram to select a continuous range of intervals. The time/date filter updates to that range, and the results reload automatically.
Indicators table
The indicators table lists indicators that match the search query and the active filters. Click the ![]() gear icon in a column header to access table actions:
gear icon in a column header to access table actions:
•Select any of the Actions: Edit columns—sort the values in the column. Use the wizard to adjust (![]() add,
add, ![]() remove,
remove, ![]()
![]() reorder) the displayed columns. You can also use drag-and-drop to adjust the columns. Click Reset to reset the table columns to their default state (default available columns in a default order). Auto-fit columns—automatically adjust column widths to fit content, Display Relative Time/Display Absolute Time—select relative timestamps (for example, 5 minutes ago) or absolute timestamps.
reorder) the displayed columns. You can also use drag-and-drop to adjust the columns. Click Reset to reset the table columns to their default state (default available columns in a default order). Auto-fit columns—automatically adjust column widths to fit content, Display Relative Time/Display Absolute Time—select relative timestamps (for example, 5 minutes ago) or absolute timestamps.
•Table Sorting: Reset Sorting—clear all applied sorting settings.
•Download as: CSV (only table data)—export up to the top 500 results of the table data as CSV.
Create incident manually
To create an incident from an existing indicator, proceed as follows:
1.Mark the check boxes next to the indicators from the table to select them and click the Add to Incident button.
You can select indicators only within one company. The selected number of indicators is limited. |
2.Select Create new incident and click Next.
3.Type Name and select Severity level, click Add.
4.The incident is manually created. You can click View incident in a notification to show incident details.
The created incident is also visible in the Incidents table.
To add an indicator to an existing incident, proceed as follows:
1.Mark the check boxes next to the indicators from the table to select them and click the Add to Incident button.
You can select indicators only within one company. The selected number of indicators is limited. |
2.Select Add to existing incident and click Next.
3.Find and select the incident from the table, and click Add.
4.The incident has been updated. You can click View incident in a notification to show incident details. In the Indicators section, you can find added indicators. The Incident Timeline section provides information about added indicators as well.
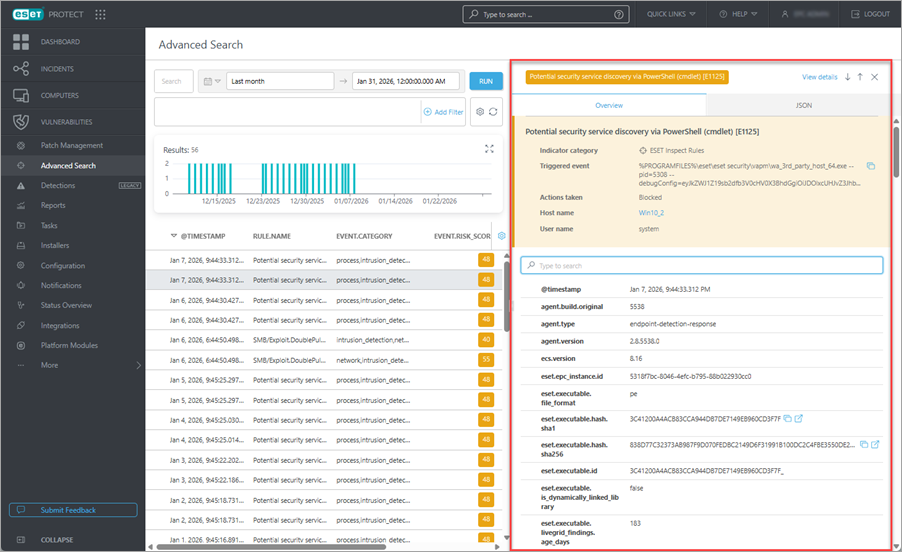
Indicator side panel
Click any row to show a detailed view of the selected indicator in the side panel. You can click View details to open a new window tab with the Indicator Details Overview (accessible also from Incidents).

•Overview—details vary by the indicator type. Panel color reflects the severity level: blue—low severity, yellow—medium severity and red—high severity.
oYou can type into the search bar to filter across field names and their values.
oYou can click the three dots ![]() button or anywhere in the attribute row to Filter in or Filter out a specific attribute, or Add column to add selected field as a table column.
button or anywhere in the attribute row to Filter in or Filter out a specific attribute, or Add column to add selected field as a table column.
oFind a detailed explanation in the Open XDR Data Format section.
•JSON—a structured JSON view of the indicator. Click Copy to Clipboard to copy the JSON.