Behavioral report for EDR/XDR license users
The behavioral report contains essential data about the inspected file and observed behavior from the sandbox analysis. Each sample can have multiple observed behaviors.
To view the report, navigate to Submitted Files in the Web Console. Select the file and click Show Details > View Behavior to see the File Behavior Report.
View and download the behavioral report
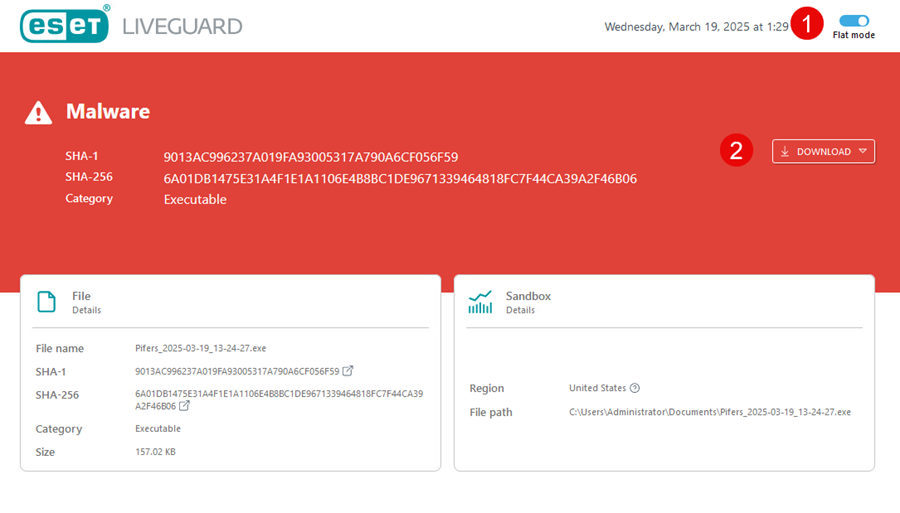
1.Flat mode—The flat mode displays all recorded actions or events in a linear list, without grouping or nesting under parent processes, categories, or hierarchies. You can turn on the flat mode by clicking the Flat mode toggle in the top corner of the report.
2.Download—EDR/XDR users can download the report by clicking the Download button next to the analysis result window. You can download the report as a PDF or JSON file. Alternatively, you can download the PDF file of the report directly from Submitted files > Export report.
The report layout
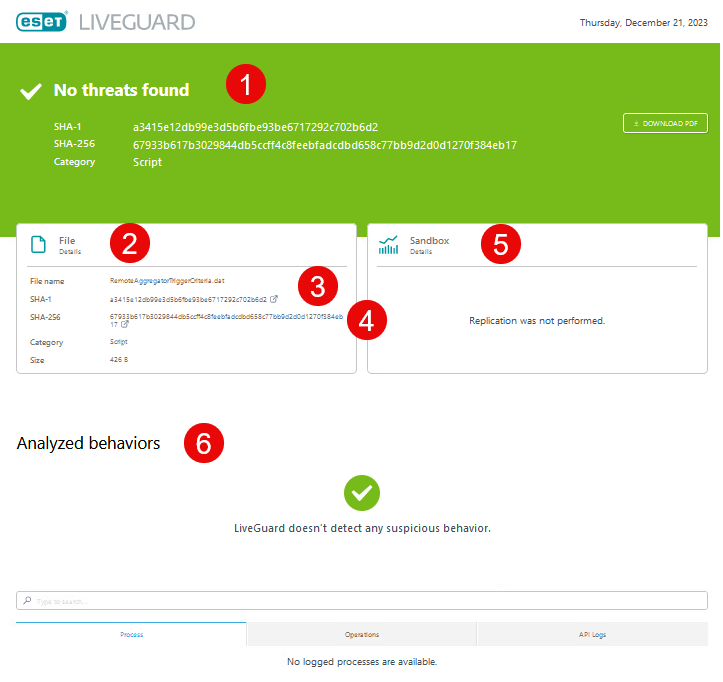
The report consists of the following:
1.Result—Final assessment of the file.
2.File details—Results from the scanning layer.
3.SHA-1 hash—Contains hash and a link to VirusTotal.
4.SHA-256 hash—Contains SHA-256 hash.
5.Sandbox details—Results from the behavioral layer.
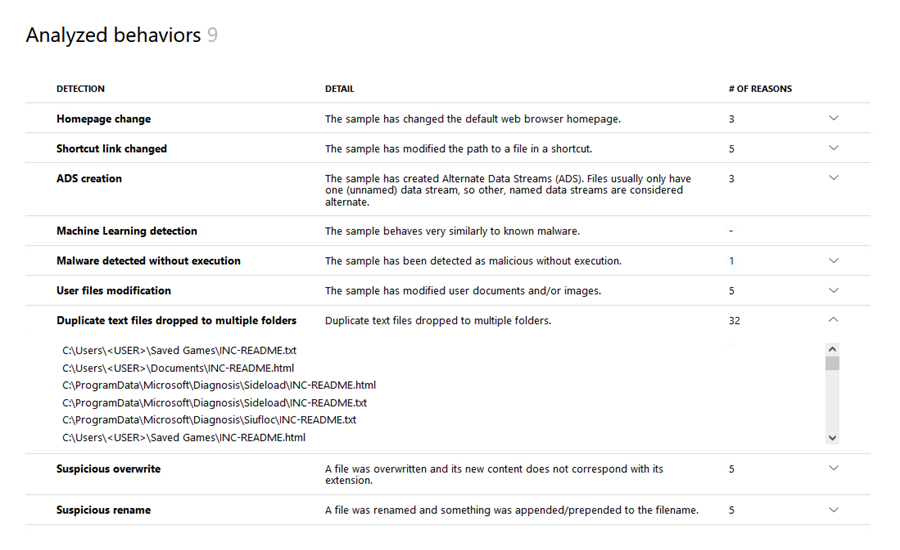
6.Analyzed behaviors—List of detected behaviors and their results. You can use the search bar to navigate through the details after analysis.
7.Static analysis—You can view the Static analysis section to analyze samples within their environments.
Behavioral report logs
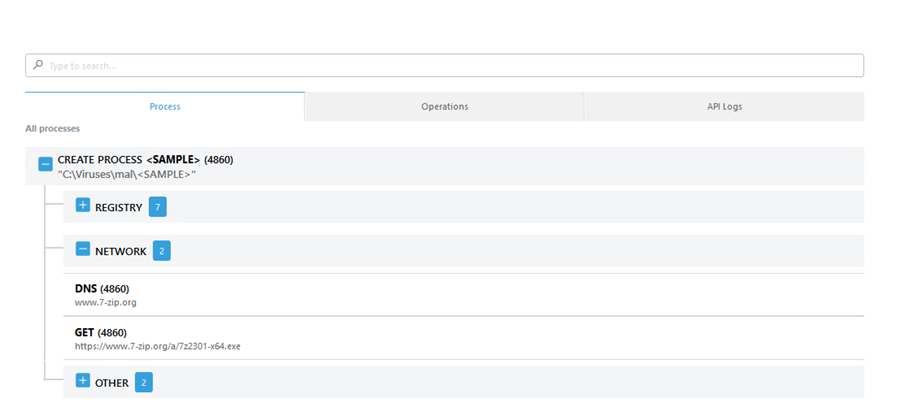
Use the Search bar or view the logs based on the following:
1.Process—The tree-structured list of actions grouped based on running processes. You can see the files and registry changes grouped by process. The Process tab is divided into these sections:
•Process—List of actions taken on processes.
•File—Details about the affected files.
•Registry—Details about the affected registries.
•Network—List of network activities.
•Other—Objects such as events, mutex, WMI queries.
2.Operations—List of actions based on operation type. The Operations tab is divided into sections:
•Process—List of actions taken on processes.
•File—Details about the affected files.
•Registry—Details about the affected registries.
•Network—List of network activities.
•Other—Objects such as events, mutex, WMI queries.
•Interaction—Detailed sandbox interaction overview.
3.API Logs—Overview of the process activity through selected system functions.
Static analysis
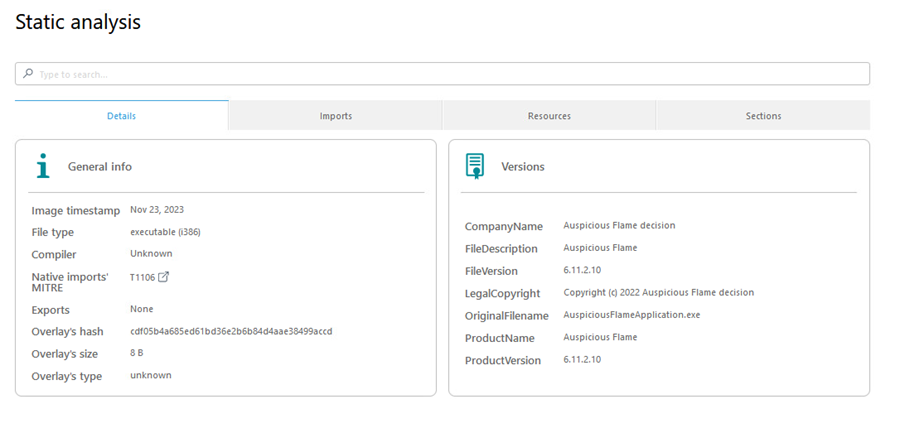
You can view the Static analysis section to analyze samples within their environments. The following tabs are available:
•Details—Two windows will display: A General info window with an overview of the file and a Versions window with the file version details.
•File geometry—Lists structural information obtained from ESET subsystems. The files included in a nested file are highlighted.
•Imports—Lists visible libraries and their imports, including those unaffected by the file. You can find the dynamically loaded libraries and their imports in the API Logs section. The files included in a nested file are highlighted.
•Exports—Lists the export functions valid for .dll files.
•Sections—Lists the portable executables containing code and data complying with the program.
•Resources—Lists the content from the .rsrc section. The files with the known file type are highlighted.
•Methods—Lists the methods and functions utilized by the samples.
•MacOS—Lists Objective-C classes specific to macOS samples. The files included in a nested file are highlighted.
The example below displays only four tabs. There may be more depending on the file type. |
