Dashboard
The Dashboard provides provides simple scan statistics.
Scan statistics
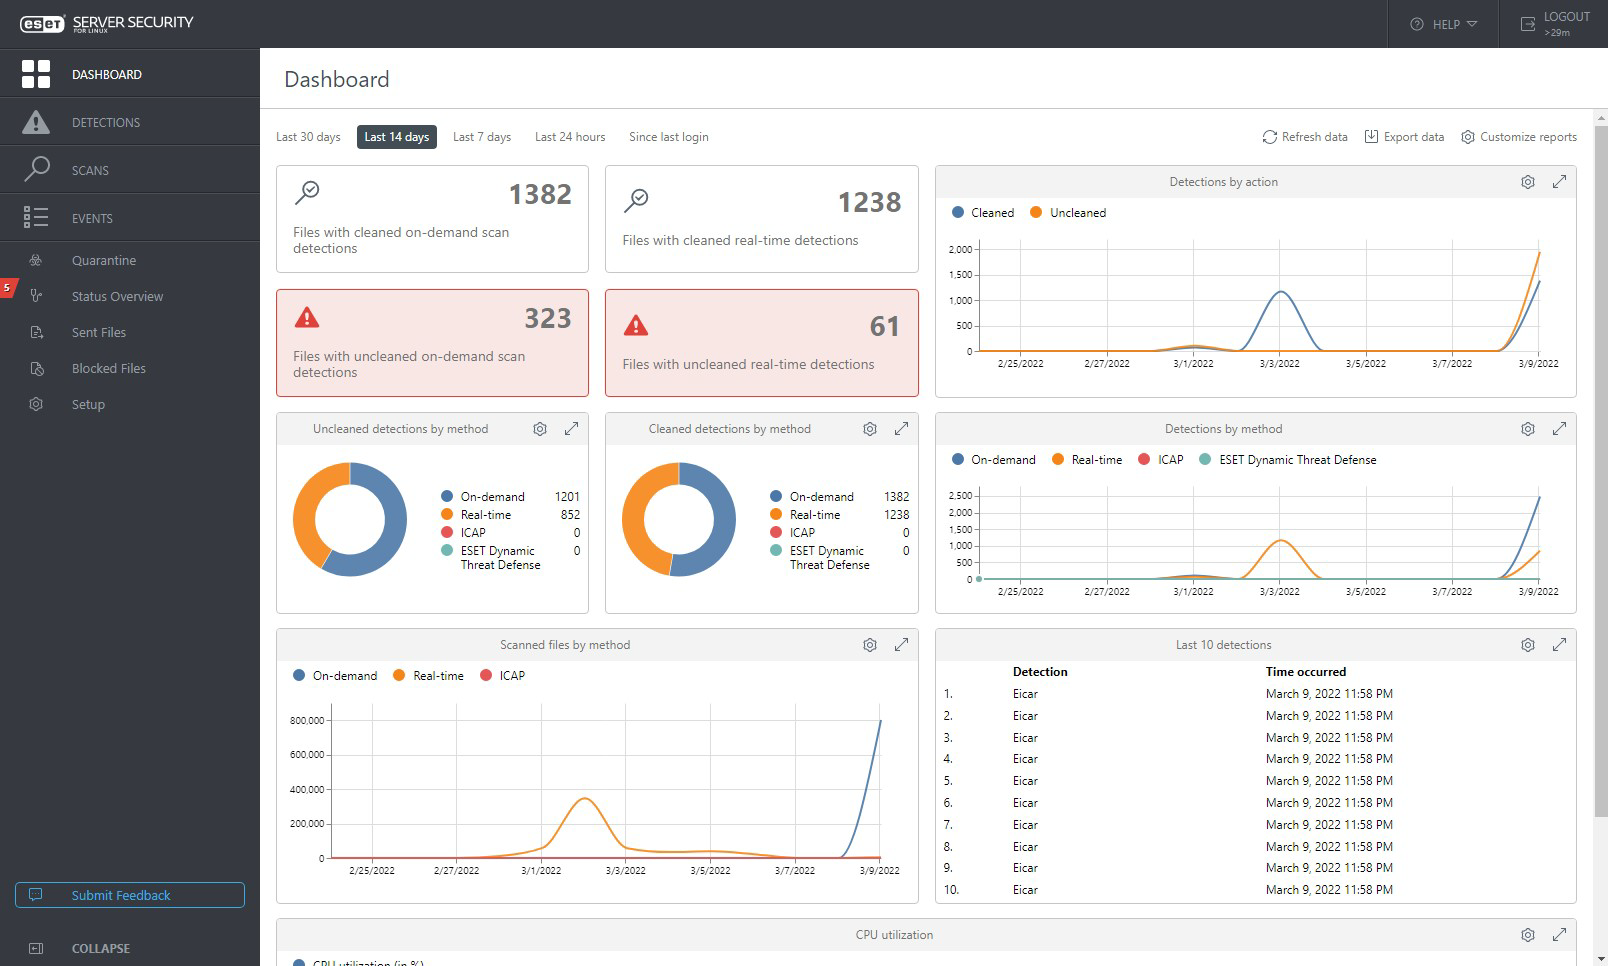
ESET Server Security for Linux provides simple scan statistics via charts or tables:
•Detections by action
•Detections by method
•Uncleaned detections by method
•Cleaned detections by method
•Scanned files by method *
•Last 10 detections
•Top 10 users with the most on-access detections
•Last 10 on-demand scans with detections
•CPU utilization *
•Memory and swap utilization *
and in the form of tiles:
•Files with cleaned on-demand scan detections
•Files with cleaned real-time detections
•Files with uncleaned on-demand scan detections
•Files with uncleaned real-time detections
|
Statistics marked by * above are not 100% accurate. Values are sampled in 15-minute intervals and further processed before display. |
Click a statistics tile or chart to go to the Scans or Detections screen. Use period presets to filter the statistics.
If the number of uncleaned detections is higher than 0, the background color of "uncleaned" statistics turns red.
Statistics to display
1.Click ![]() Customize reports.
Customize reports.
2.Select/deselect the desired statistics.
3.Click Save.
To remove single statistics, click its configuration button ![]() , select Remove.
, select Remove.
The configuration of statistics remains intact, unless you delete the browser cache.
Download scan statistics
To download all scan statistics for the selected period as a .zip archive file, click ![]() Export Data. The .zip archive file contains the statistics in .csv files.
Export Data. The .zip archive file contains the statistics in .csv files.
To download specific scan statistics, click its configuration button ![]() , select Download, then select CSV or PDF.
, select Download, then select CSV or PDF.