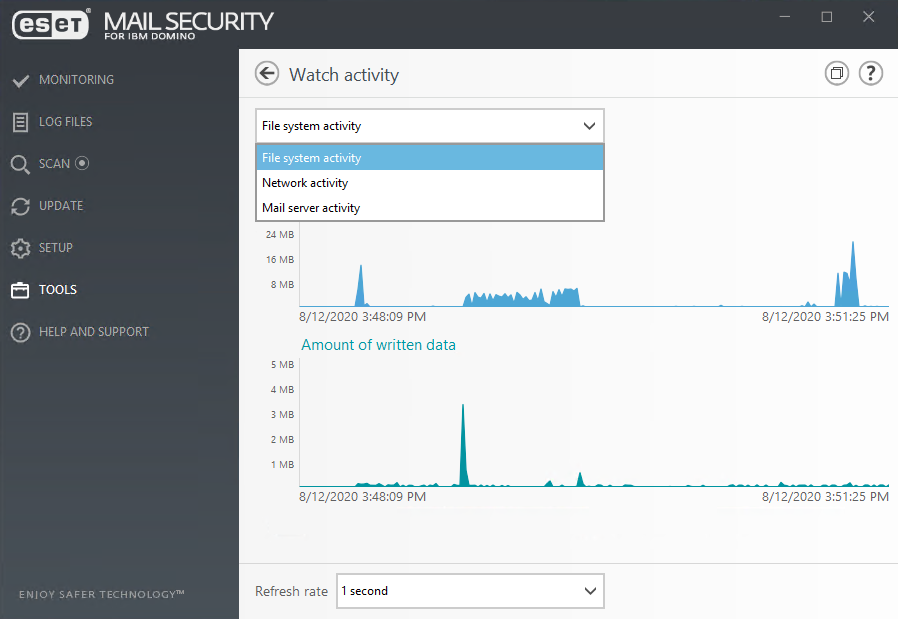
Watch activity
To Watch activity contain activity in graph form, select from drop-down menu following activity:
File system activity
Amount of read or written data. The vertical axis of graph represents read data (blue) and written data (green).
Network activity
Amount of received of sent data. The vertical axis of graph represents received data (blue) and sent data (green).
Mail server activity
Amount of processed data by Transport protection (blue) and Database protection (green).
At the bottom of the graph is a timeline that records file system activity in real-time based on the selected time span. Use the Refresh rate drop-down menu to change the frequency of updates.
The following options are available:
1 second |
The graph refreshes every second and the timeline covers the last 10 minutes. |
|---|---|
1 minute (last 24 hours) |
The graph is refreshed every minute and the timeline covers the last 24 hours. |
1 hour (last month) |
The graph is refreshed every hour and the timeline covers the last month. |
1 hour (selected month) |
The graph is refreshed every hour and the timeline covers the selected month. Select a month (and a year) from the drop-down menu to see activity. Click Change. |