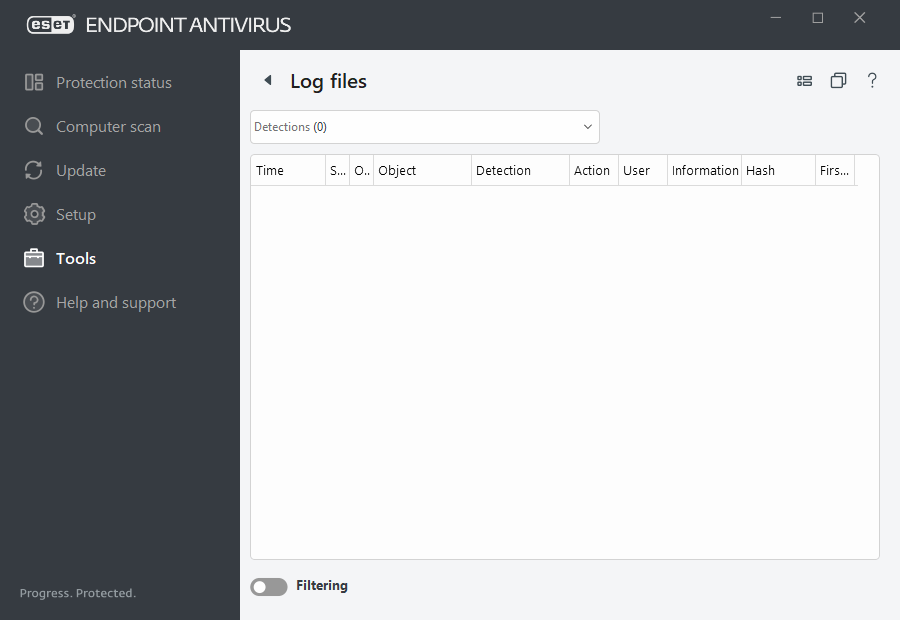
Log files
Log files contain information about all important program events that have occurred and provide an overview of detected threats. Logs are an essential tool in system analysis, threat detection and troubleshooting. Logging is performed actively in the background with no user interaction. Information is recorded based on the current log verbosity settings. You can view text messages and logs directly from the ESET Endpoint Antivirus environment. It is also possible to archive log files.
Log files are accessible from the main program window by clicking Tools > Log files. Select the desired log type from the Log drop-down menu. The following logs are available:
- Detections—This log offers detailed information about detections and infiltrations detected by ESET Endpoint Antivirus modules. The information includes the time of detection, name of detection, location, the performed action and the name of the user logged in at the time the infiltration was detected. Double-click any log entry to display its details in a separate window. Not-cleaned infiltrations are always marked with red text on light red background, cleaned infiltrations are marked with yellow text on white background. Not-cleaned PUAs or Potentially unsafe applications are marked with yellow text on white background.
- Events—All important actions performed by ESET Endpoint Antivirus are recorded in the event log. The event log contains information about events and errors that have occurred in the program. It is designed to help system administrators and users resolve problems. Often the information found here can help you find a solution for a problem occurring in the program.
- Computer scan—All scan results are displayed in this window. Each line corresponds to a single computer control. Double-click any entry to view the details of the respective scan.
- Blocked files—Contains records of blocked files that could not be accessible when connected to ESET Enterprise Inspector. The protocol shows the reason and the source module that blocked the file, as well as the application and user that executed the file. For more information, see the ESET Enterprise Inspector Online user guide.
- Sent files—Contains records of files that were sent to ESET LiveGrid® or ESET LiveGuard for analysis.
- Audit logs—Each log contains information about the date and time when the change was performed, type of change, description, source and user. See Audit logs for more details.
- HIPS—Contains records of specific rules that are marked for recording. The protocol shows the application that called the operation, the result (whether the rule was permitted or prohibited) and the name of the rule created.
- Network protection—The firewall log displays all remote attacks detected by Network attack protection. Here you will find information about any attacks on your computer. The Event column lists the detected attacks. The Source column informs you more about the attacker. The Protocol column reveals the communication protocol used for the attack. Analysis of the network protection log may help you to detect system infiltration attempts in time to prevent unauthorized access to your system. For more details on specific network attacks, see IDS and advanced options.
- Filtered websites—This list is useful if you want to view a list of websites that were blocked by Web access protection. In these logs you can see the time, URL, user and application that opened a connection to the specific website.
- Device control—Contains records of removable media or devices that were connected to the computer. Only devices with a Device control rule will be recorded to the log file. If the rule does not match a connected device, a log entry for a connected device will not be created. Here you can also see details such as device type, serial number, vendor name and media size (if available).

Select the contents of any log and press Ctrl + C to copy it to the clipboard. Hold Ctrl + Shift to select multiple entries.
Click ![]() Filtering to open the Log filtering window where you can define the filtering criteria.
Filtering to open the Log filtering window where you can define the filtering criteria.
Right-click a specific record to open the context menu. The following options are available in the context menu:
- Show—Shows more detailed information about the selected log in a new window.
- Filter same records—After activating this filter, you will only see records of the same type (diagnostics, warnings, ...).
- Filter—After clicking this option, you can define filtering criteria for specific log entries in the Log filtering window.
- Enable filter—Activates filter settings.
- Disable filter—Clears all filter settings (as described above).
- Copy/Copy all—Copies information about all the records in the window.
- Copy cell—Copies the content of the right-clicked cell.
- Delete/Delete all—Deletes the selected record(s) or all the records displayed—this action requires administrator privileges.
- Export—Exports information about the record(s) in XML format.
- Export all—Export information about all records in XML format.
- Find/Find next/Find previous—After clicking this option, you can define filtering criteria to highlight the specific entry in the Log filtering window.
- Create exclusion—Create a new Detection exclusion using a wizard (Not available for malware detections).
