Watch activity
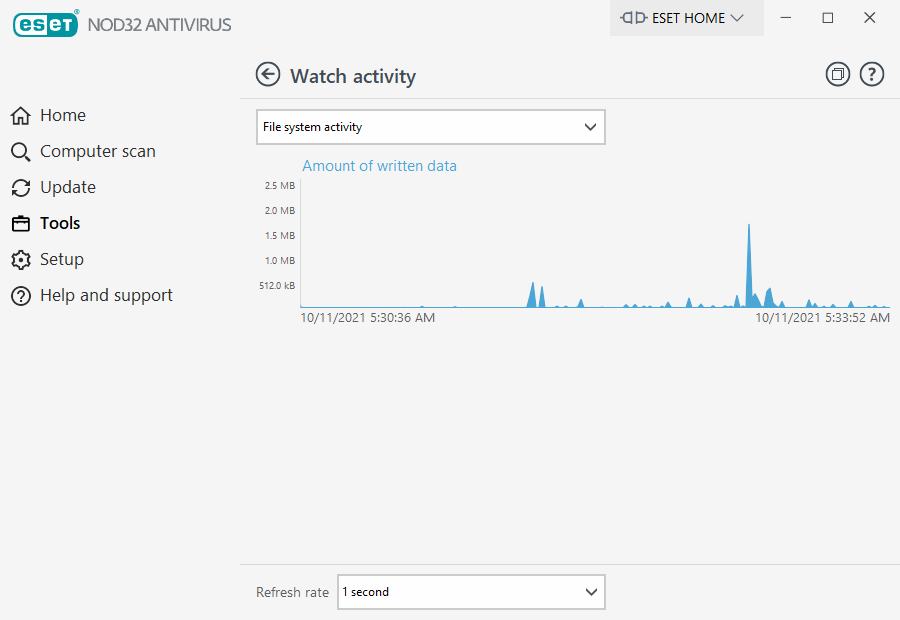
To see the current File system activity in graph form, click Tools > Watch activity. At the bottom of the graph is a timeline that records file system activity in real-time based on the selected time span. To change the time span, select the applicable value from the Refresh rate drop-down menu.
The following options are available:
•Step: 1 second – The graph refreshes every second, and the timeline covers the last 10 minutes.
•Step: 1 minute (last 24 hours) – The graph refreshes every minute, and the timeline covers the last 24 hours.
•Step: 1 hour (last month) – The graph refreshes every hour, and the timeline covers the last month.
The vertical axis of the File system activity graph represents the amount of written data. The value is in KB (kilobytes)/MB/GB. Hover your mouse over the graph to see the exact amount of written data at a specific time.