Monitor an endpoint
|
The ESET monitoring component for ESET Direct Endpoint Management plugin for Datto RMM offers a variety of options to configure for your endpoints: •ESET is installed and running •Virus definition is up to date •Product version status (up-to-date check) •Protection Status •Activation Status •Threat Logs •Scan Logs |
To create a new monitor:
1.Click Sites and into the site you want to monitor.
2.Click Policies > New site policy.
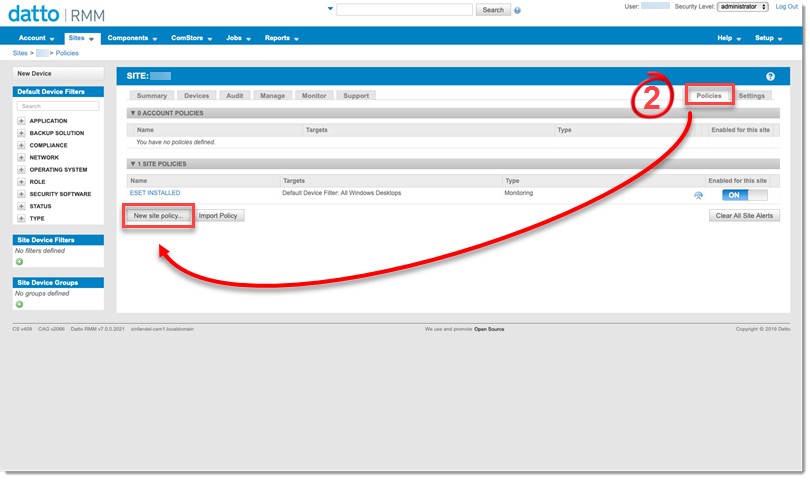
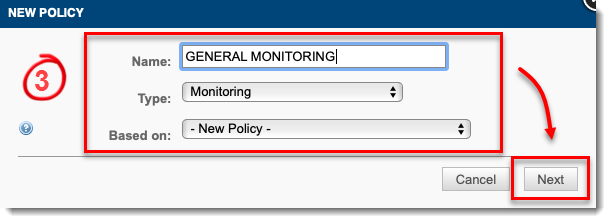
3.Give your policy a Name, verify Type is set to Monitoring and set this as a new policy. Click Next.
4.Click Add a target and select the Target type. Set the Default Device Filter as needed, for example, All Windows Desktops.
5.In the Add a monitor drop-down menu, select Component Monitor as monitor type and click Next.
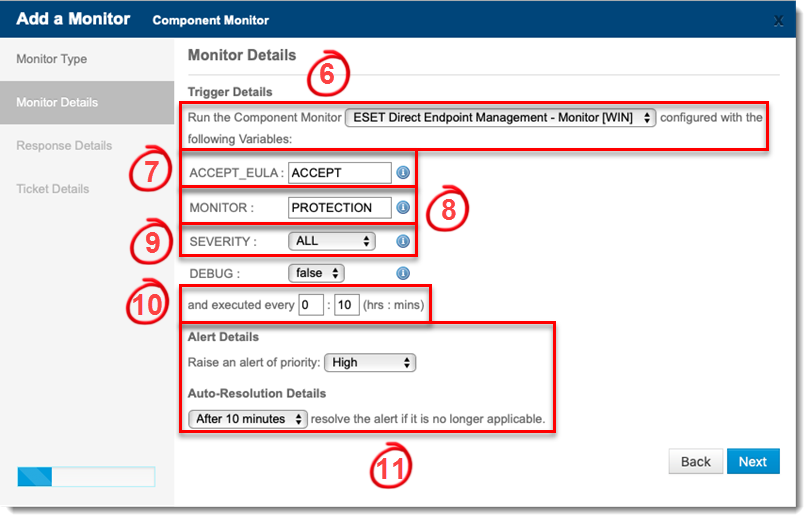
6.In the drop-down menu, select the appropriate ESET Direct Endpoint Management - Monitor component monitor. A list of available variables displays. For details on each variable, hover over the information icon.
|
Select an operating system component: Windows [WIN], macOS [MAC] or Linux [LINUX]. |
7.To accept the terms of the End User License Agreement, in the ACCEPT_EULA field, type ACCEPT.
8.In the Monitor field, type one of the following values:
•INSTALLED—Monitor if ESET is installed and running
•UPDATE_STATUS=3h—Monitor the time between the last successful virus definition update, where "3h" is 3 hours. Supports (m)inutes, (h)ours and (d)ays.
•PROTECTION—Monitor ESET Protection Status
•ACTIVATION—Monitor ESET Product Activation Status
•THREAT—Monitor new threat logs on an endpoint
•SCAN—Monitor new scan logs on an endpoint
9.Select the Severity from the drop-down menu options: All, Diagnostic, Info, Warning, Error and Critical.
10. Input the monitor execution rate in hours and minutes.
11. Select the Alert Priority and Auto-Resolution Details. Click Next.
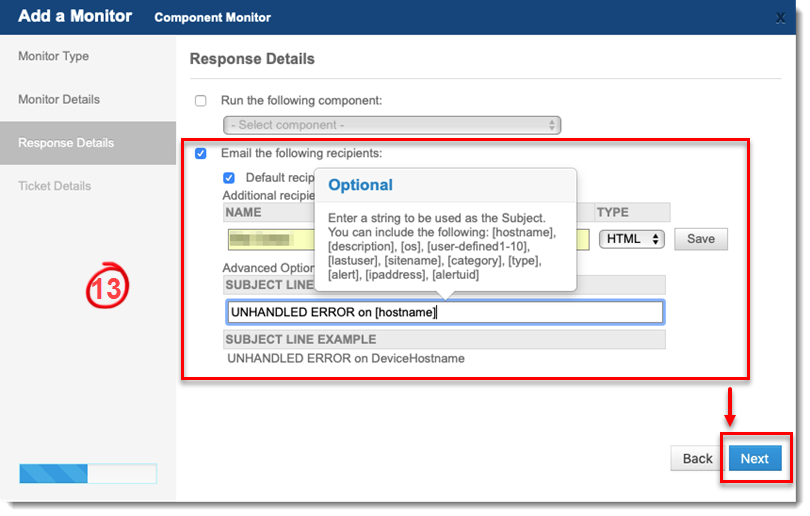
12. The Response Details page lets you configure a component to respond when the monitor triggers an event.
13. Configure the monitor to send an email with the configured details listed on this page, click Next.
14. Configure a ticket to generate when this monitor raises an event, click Next.
15. Click Save. The new policy will appear with the toggle set to On for Enabled for this site.
16. To begin monitoring, click Push changes.
Depending on how the monitor was configured, you should receive an email or a ticket will generate based on a monitored event. To see any raised alerts, in the appropriate site, click Monitor. The alert message will give you a brief overview of what the event is about, click the message for more details.